Auditorium analysis
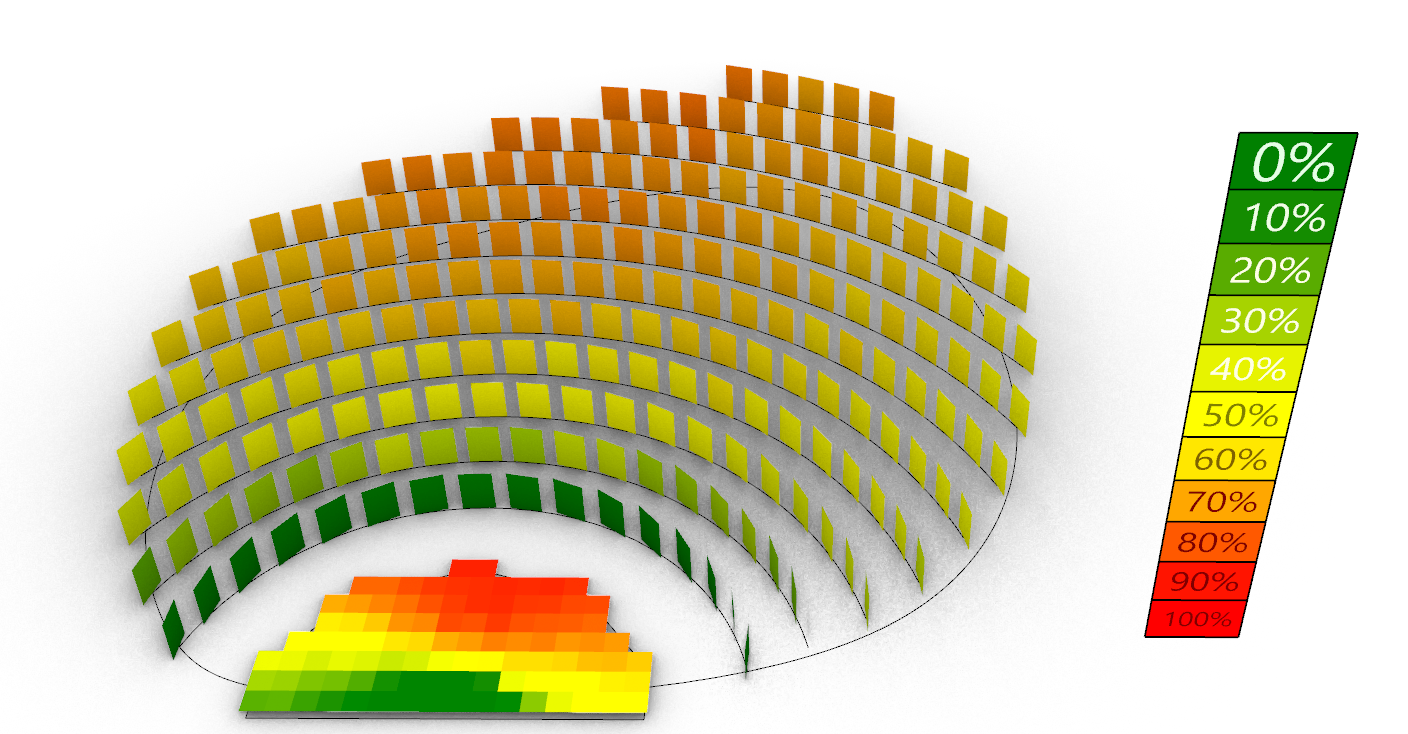
Here is a breakdown of an algorithm that can be used to generate and analyse various auditoria.
It takes few geometric and numerical parameters, populates the seats and performs visibility study for the area of the stage.
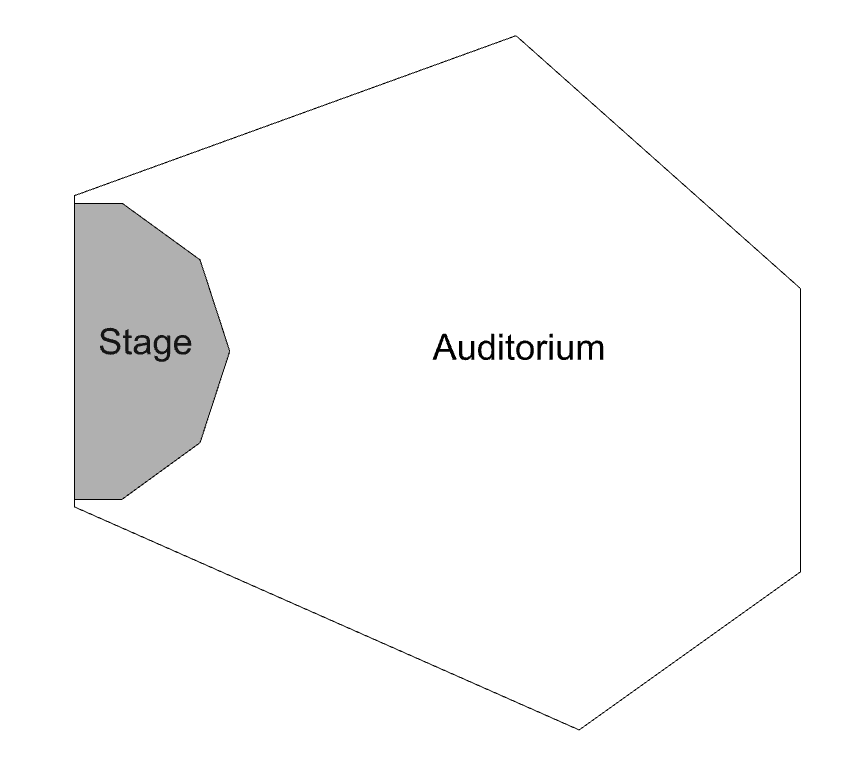
The initial input for the analysis can start as low as defining only the stage as a GH_Plane and the input curve for the perimeter of the auditorium as shown below.
Step 1
We can populate the seats for the auditorium in a generative manner. At first, we need to generate the guiding curves that will host the positions for the seats. There are various methods for having this. In this example, a simple radial distribution is used.
Below is the implementation and the result of this step.
The necessary parameters are:
- First radius
- Consequent radii
- Trimming regiun (room perimeter)


Step 2
Next on, we need to elevate the curves by Z-axis and generate the points with the necessary spacing. The count is decided with a TotalLength/UnitLength logic.


Step 3
For the next step, we will create the planes that are oriented towards the stage area centre. This step is necessary for the proper generation of the seat geometry.


Step 4
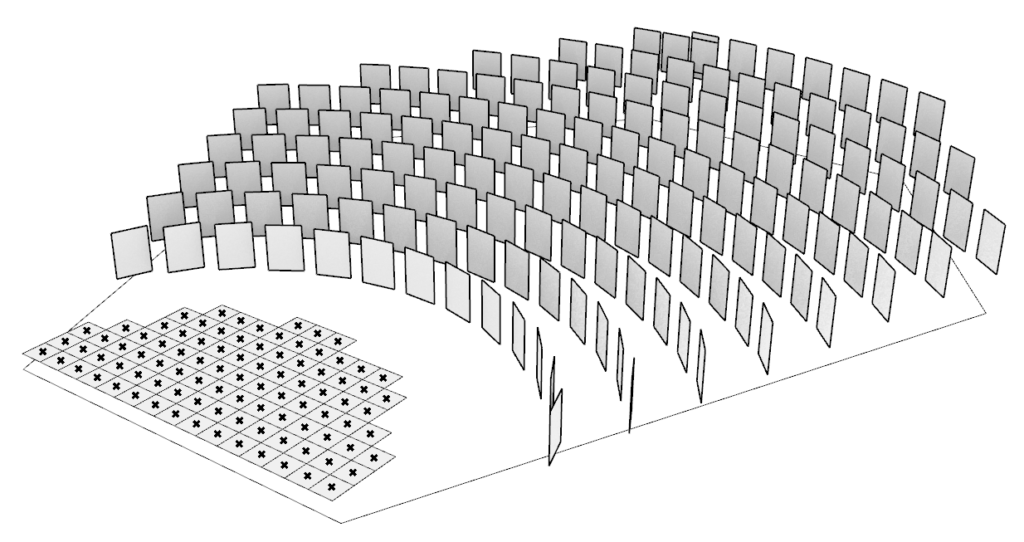
Next, we will need to create the measurement grid on the stage so that we can track which part of the stage is obstructed. Here we need the stage surface and the division size parameter. We can divide the surface with UV and take only the grid squares whose area centres are inside the stage perimeter as shown below.


Step 5
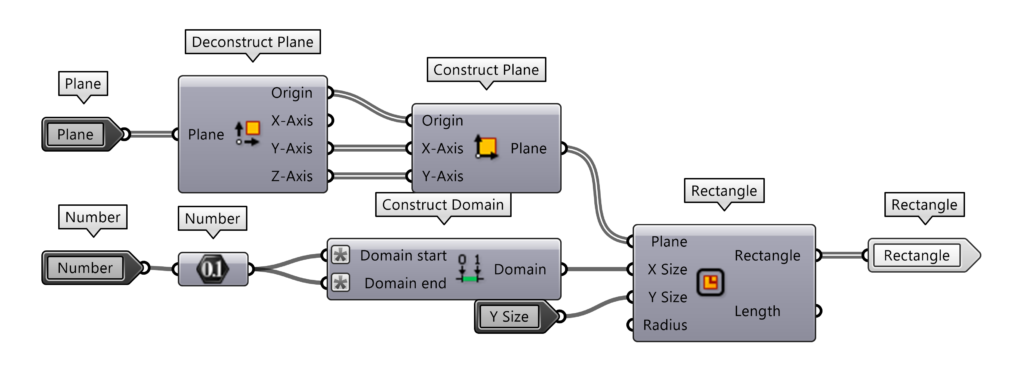
Since the obstruction of vision is going to be caused by the seats themselves, we need to create the corresponding geometries. Here the oriented planes are flipped vertically, then the seat representing rectangles are generated. For the simplicity of computation, they are kept flat.
Step 6
So here in this stage, we want to understand two things.
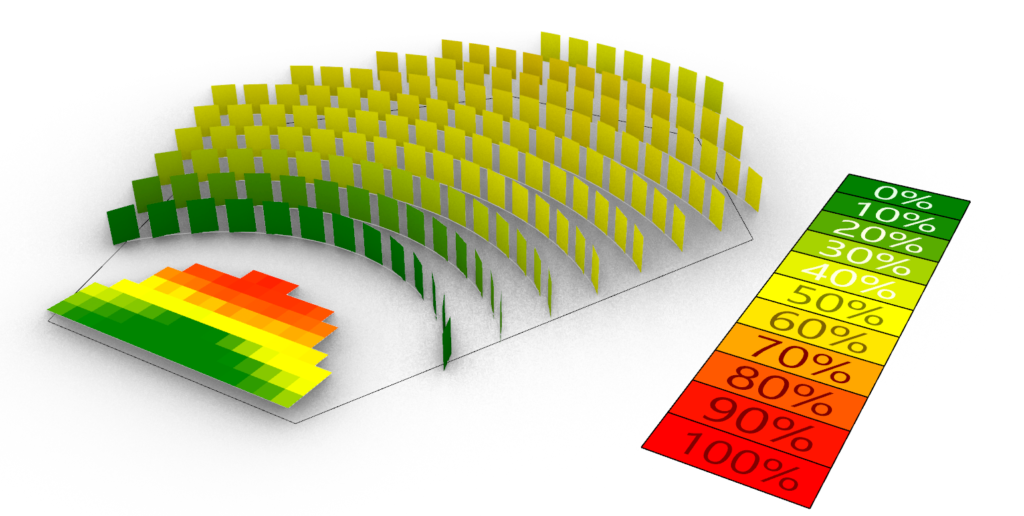
- For each cell of the stage – how much percentage of the seats cannot see it
- For each seat – how much percentage of the stage is obstructed
In order to solve this, first, all the rectangle surfaces for seats are unified into a single obstruction mesh for faster computation.
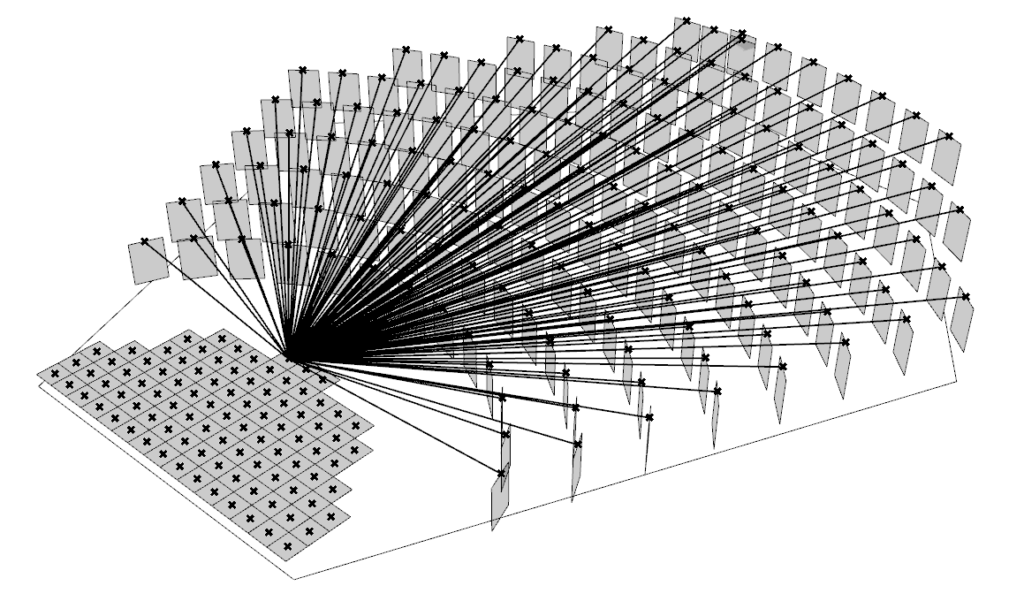
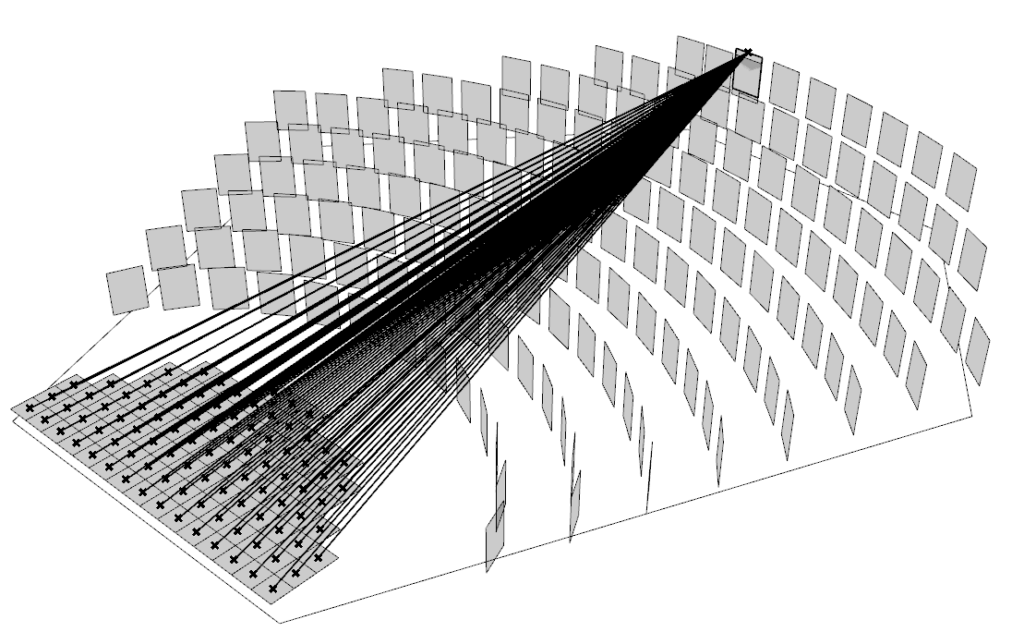
Then for each stage cell – seat pair a line is constructed representing the vision. After this, we can test the vision lines for intersection with the unified obstruction mesh and see which stage cells are visible from where. The resulting data tree will be used to compute the percentage. Depending on how is the script made (which input is grafted) the tree initially may show the results for the cells and for the seats if flipped or vice versa.


Step 7
The results obtained in the previous stage can be used for the colour coded visualization of the auditorium and the stage alike. Since both of the results will be shown in percentages a single legend can be used with the same colour gradient.

Overview
Below is shown how all the different parts of the algorithm are combined together
